

You can find on this page the Japan population map to print and to download in PDF. The Japan population density map presents the number of inhabitants in relation to the country size and the structure of the population of Japan in Asia.
The Japan population density map shows the number of inhabitants in relation to Japan size. This demographic map of Japan will allow you to know demography and structure of the population of Japan in Asia. The Japan density map is downloadable in PDF, printable and free.
The current population of Japan is 126,318,953 as of Thursday, November 26, 2020, based on Worldometer elaboration of the latest United Nations data. Japan 2020 population is estimated at 126,476,461 people at mid year according to UN data. Japan population density is equivalent to 1.62% of the total world population as its mentioned in Japan population density map.
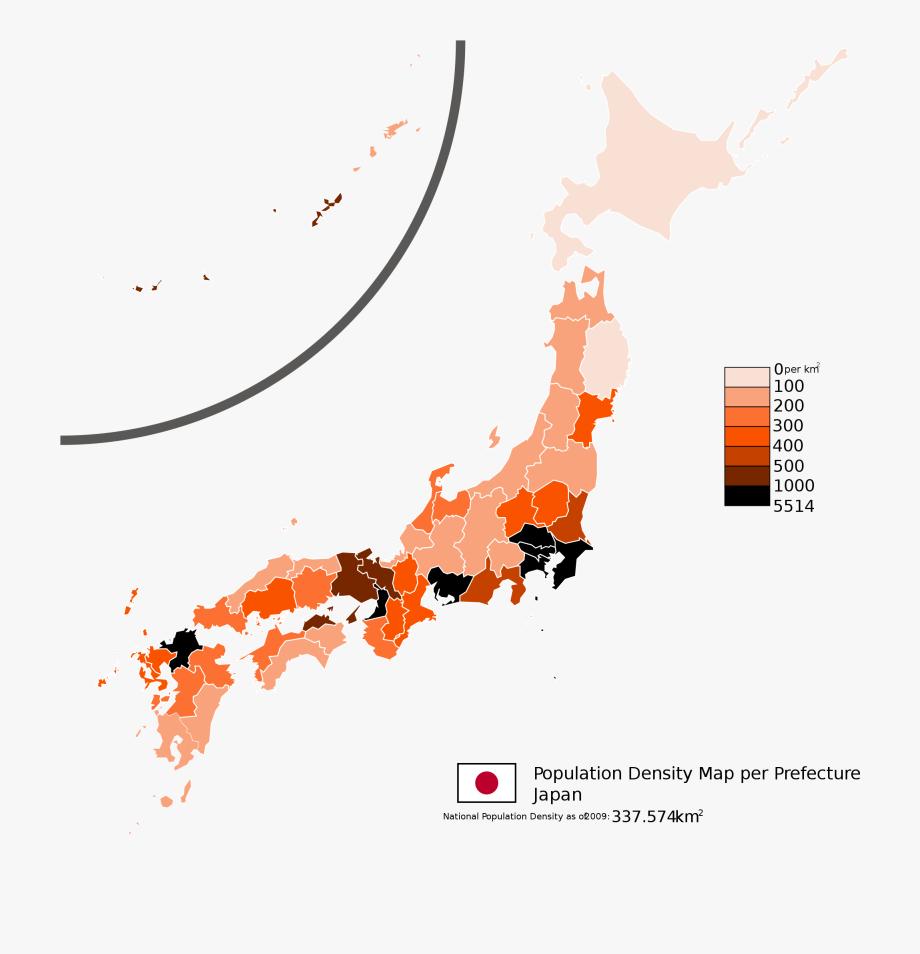
Japan ranks number 11 in the list of countries (and dependencies) by population. The population density in Japan is 347 per Km2 (899 people per mi2) as you can see in Japan population density map. The total land area is 364,555 Km2 (140,755 sq. miles). 91.8 % of the population is urban (116,099,672 people in 2020). The median age in Japan is 48.4 years.
Japan population of more than 127 million makes it the world 10th-mostpopulated nation. Japan population is almost one-third larger than Germany and more than twice the size of the individual populations of the United Kingdom, Italy, and France. Japan average population density per square mile is comparable to such small countries as Belgium and the Netherlands as you can see in Japan population density map, these countries are flat with far more arable land. Population density per unit of area cultivated is the largest in the world.